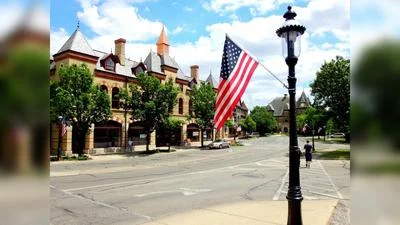
Bronzeville Academy Charter School Principal Mr. Alvin Boutte (2023) | Bronzeville Academy Charter School
Bronzeville Academy Charter School Principal Mr. Alvin Boutte (2023) | Bronzeville Academy Charter School
There were 681,774 students enrolled in Cook County districts in the 2021-22 school year, of which 206,904 students were absent throughout the year.
The districts located in the county had a dropout rate 3.7%, which was 1.3% higher than the year before.
Across the county, Bronzeville Academy Charter School suffered the most truancy issues (71.8%) in the 2021-22 school year. Meanwhile, Berkeley School District 87 successfully recorded the lowest truancy rate in the region (0.5%).
Students are generally considered chronically truant if they miss 5% or more of the total number of school days in a year without acceptable excuses.
The main offices of all districts mentioned in the story are located in cities associated with Cook County.
In 2022, Illinois had 1,925,415 students enrolled in a total of 3,977 schools. There were 130,467 teachers in the public schools, or roughly one teacher for every 15 students, compared to the national average of 1:16.
K-12 enrollment has been declining in Illinois for many years, reflecting demographic changes. Combined public and private K-12 enrollment dropped 3% between the 2019–2020 and 2020–2021 school years (60,900 students), far more than the typical 0.5% to 1.5% annual enrollment declines in Illinois over the last five years.
| District | No. of students enrolled | Chronic truancy rates |
|---|---|---|
| Bronzeville Academy Charter School | 339 | 71.8% |
| Hazel Crest School District 152-5 | 849 | 70.4% |
| West Harvey-Dixmoor Public School District 147 | 754 | 69.9% |
| Betty Shabazz International Charter School | 558 | 69.3% |
| General George Patton School District 133 | 210 | 69.2% |
| Urban Prep West Charter School | 91 | 68.9% |
| Thornton Township High School District 205 | 4,584 | 68.8% |
| Country Club Hills School District 160 | 1,236 | 66.1% |
| ACE Amandla Charter School | 126 | 66.1% |
| Rich Township High School District 227 | 2,595 | 64.6% |
| Bellwood School District 88 | 2,129 | 58.2% |
| Bloom Township High School District 206 | 2,888 | 57.7% |
| South Holland School District 151 | 1,512 | 53.6% |
| Chicago Public School District 299 | 327,338 | 52% |
| Sandridge School District 172 | 359 | 50.7% |
| Calumet Public School District 132 | 959 | 50.5% |
| Horizon Science Acad-McKinley Park | 863 | 48.6% |
| Proviso Township High School District 209 | 4,415 | 47.1% |
| Chicago Heights School District 170 | 2,654 | 47.1% |
| Lincoln Elementary School District 156 | 779 | 46.6% |
| Burnham School District 154-5 | 166 | 45% |
| Hoover-Schrum Memorial School District 157 | 836 | 43.2% |
| Maywood-Melrose Park-Broadview School District 89 | 4,258 | 39.7% |
| South Holland School District 150 | 808 | 38.9% |
| Harvey School District 152 | 1,647 | 37.3% |
| J. Sterling Morton High School District 201 | 7,890 | 36.6% |
| Prairie-Hills Elementary School District 144 | 2,582 | 35.5% |
| Elementary School District 159 | 1,661 | 35% |
| Horizon Science Acad-Belmont | 555 | 34.6% |
| Park Forest School District 163 | 1,480 | 34.6% |
| Calumet City School District 155 | 958 | 30.8% |
| Cicero School District 99 | 9,228 | 29.5% |
| Dolton School District 149 | 2,242 | 28% |
| Cook County School District 130 | 3,023 | 27.8% |
| Community Consolidated School District 168 | 1,262 | 26.4% |
| Evanston Community Consolidated School District 65 | 6,661 | 25.9% |
| Berwyn North School District 98 | 2,504 | 25% |
| Community High School District 218 | 5,341 | 23.8% |
| Thornton Fractional Township High School District 215 | 3,238 | 23.1% |
| Maine Township High School District 207 | 6,199 | 21.9% |
| Flossmoor School District 161 | 2,267 | 21.8% |
| Forest Park School District 91 | 700 | 21.3% |
| River Grove School District 85-5 | 668 | 19.9% |
| Oak Lawn Community High School District 229 | 1,814 | 18.8% |
| East Maine School District 63 | 3,458 | 17.6% |
| Steger School District 194 | 1,438 | 17.5% |
| Homewood-Flossmoor Community High School District 233 | 2,720 | 17.4% |
| Evanston Township High School District 202 | 3,653 | 17.1% |
| Township High School District 214 | 11,907 | 16.3% |
| Lyons School District 103 | 2,121 | 16.3% |
| Reavis Township High School District 220 | 1,983 | 16% |
| Berwyn South School District 100 | 3,103 | 15.9% |
| Homewood School District 153 | 1,892 | 15.8% |
| Evergreen Park Elementary School District 124 | 1,796 | 15.4% |
| Argo Community High School District 217 | 1,886 | 15% |
| Oak Park and River Forest District 200 | 3,329 | 14.8% |
| Community Consolidated School District 59 | 5,808 | 14.2% |
| Palatine Community Consolidated School District 15 | 11,080 | 13.7% |
| Burbank School District 111 | 3,232 | 13.5% |
| Skokie School District 69 | 1,733 | 13.2% |
| Leyden Community High School District 212 | 3,392 | 12.7% |
| Arbor Park School District 145 | 1,087 | 12.5% |
| Riverside Brookfield Township School District 208 | 1,625 | 12.4% |
| Indian Springs School District 109 | 2,413 | 12.4% |
| Niles Township Community High School District 219 | 4,556 | 12% |
| Westchester School District 92-5 | 1,014 | 11.9% |
| Central Stickney School District 110 | 315 | 11.8% |
| Willow Springs School District 108 | 357 | 11.7% |
| Morton Grove School District 70 | 854 | 11.2% |
| Atwood Heights School District 125 | 574 | 10.6% |
| Des Plaines Community Consolidated School District 62 | 4,213 | 10.6% |
| Hillside School District 93 | 407 | 10.3% |
| Ridgeland School District 122 | 2,300 | 8.7% |
| North Palos School District 117 | 3,360 | 8.6% |
| Skokie School District 73-5 | 1,044 | 8.5% |
| River Trails School District 26 | 1,499 | 7.9% |
| Elmwood Park Community Unit School District 401 | 2,788 | 7.5% |
| Orland School District 135 | 5,149 | 7.2% |
| Evergreen Park Community High School District 231 | 933 | 7% |
| West Northfield School District 31 | 907 | 6.9% |
| Community Consolidated School District 146 | 2,307 | 6.7% |
| Chicago Ridge School District 127-5 | 1,375 | 6.5% |
| Kirby School District 140 | 3,487 | 5.8% |
| Forest Ridge School District 142 | 1,473 | 5.7% |
| Kenilworth School District 38 | 464 | 5.5% |
| Township High School District 211 | 11,981 | 5.5% |
| Southland College Prep Charter High School | 575 | 5.2% |
| Golf Elementary School District 67 | 684 | 4.9% |
| Summit School District 104 | 1,515 | 4.9% |
| Oak Lawn-Hometown School District 123 | 3,277 | 4.7% |
| Lemont-Bromberek Combined School District 113A | 2,395 | 4.6% |
| Pleasantdale School District 107 | 820 | 4.1% |
| LaGrange Highlands School District 106 | 982 | 4.1% |
| Schaumburg Community Consolidated School District 54 | 14,957 | 3.7% |
| Ridgewood Community High School District 234 | 784 | 3.6% |
| Winnetka School District 36 | 1,609 | 3.5% |
| New Trier Township High School District 203 | 3,846 | 3.3% |
| Northfield Township High School District 225 | 5,096 | 3.2% |
| Alsip-Hazelgreen-Oaklawn School District 126 | 1,478 | 3% |
| Northbrook Elementary School District 27 | 1,309 | 3% |
| Park Ridge Consolidated Community School District 64 | 4,563 | 2.9% |
| Lyons Township High School District 204 | 3,919 | 2.7% |
| Skokie School District 68 | 1,645 | 2.7% |
| Wheeling Community Consolidated School District 21 | 5,794 | 2.5% |
| Consolidated High School District 230 | 7,644 | 2.4% |
| Oak Park Elementary School District 97 | 5,532 | 2.4% |
| Lemont Township High School District 210 | 1,364 | 2.3% |
| Norridge School District 80 | 1,052 | 2.1% |
| Union Ridge School District 86 | 648 | 2.1% |
| Glenview Community Consolidated School District 34 | 4,281 | 1.8% |
| Midlothian School District 143 | 1,561 | 1.6% |
| Dolton School District 148 | 1,894 | 1.5% |
| Palos Community Consolidated School District 118 | 2,017 | 1.2% |
| La Grange School District 105 South | 1,192 | 1% |
| Riverside School District 96 | 1,660 | 0.9% |
| La Grange School District 102 | 2,962 | 0.9% |
| Bremen Community High School District 228 | 5,038 | 0.8% |
| Berkeley School District 87 | 2,312 | 0.5% |
ORGANIZATIONS IN THIS STORY
!RECEIVE ALERTS
DONATE


 Alerts Sign-up